

There’s no question that making your website’s pages load fast is important. Research shows that people start to lose focus on something after a single second, and lose interest completely somewhere between 4 and 10 seconds. There’s even a direct correlation between slow load times and losing sales, according to Amazon and Kissmetrics. But who has time for complex tools like reading waterfall charts? The easy solution would be to just keep files small and design simple, right?
Maybe not. Modern design trends are heading towards animation and detailed, fullscreen images. If you don’t have these assets, your site may look washed out next to your competitors. And while these features may increase user engagement and sales in a vacuum, they don’t do anything for you if they bog down your site so much that nobody ever sees them. This isn’t even mentioning the fact that Google started including page speed in their ranking algorithms.
Big media isn’t the only things that can slow a website down, either. This is where a skill like reading waterfall charts can come in handy, as these tools provide a powerful analysis of every step between DNS connections and a full page render.
The Best Starting Point: Reading Waterfall Charts
Tools like Pingdom and Google PageSpeed Insights can give you a decent idea of where to start, but the truly best starting point in a waterfall chart, like the ones provided by Web Page Test. These in-depth tools give you an impressive breakdown of everything that’s loading on your site: when they start, when they’re visible, when they finish, and how they relate to every other file. While Pingdom and Google may point you in the right direction, a waterfall chart will show you exactly where to go.
After you run your test, you’ll see a general score at the top of the page, just like other tools.
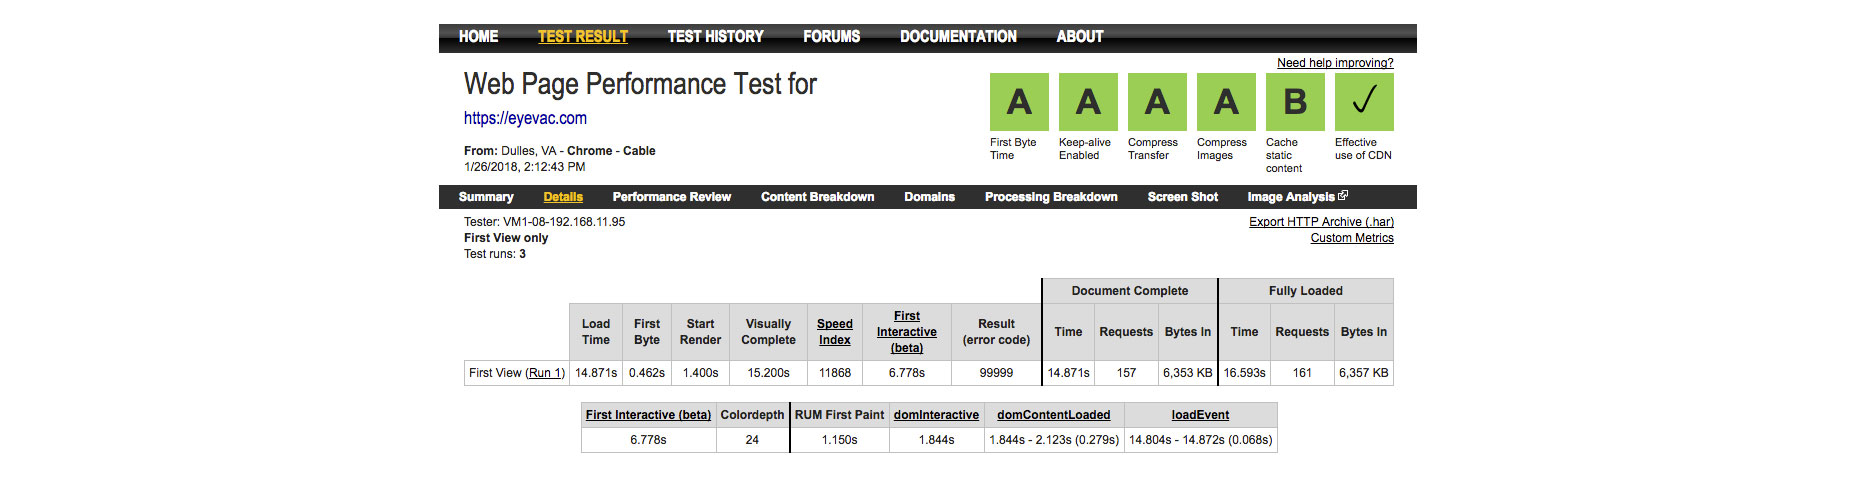
It’s important not to get distracted by this, though. The true power of this tool is a simple scroll away, by reading the waterfall chart itself. Below you’ll find the first one third or so of the same site’s test.
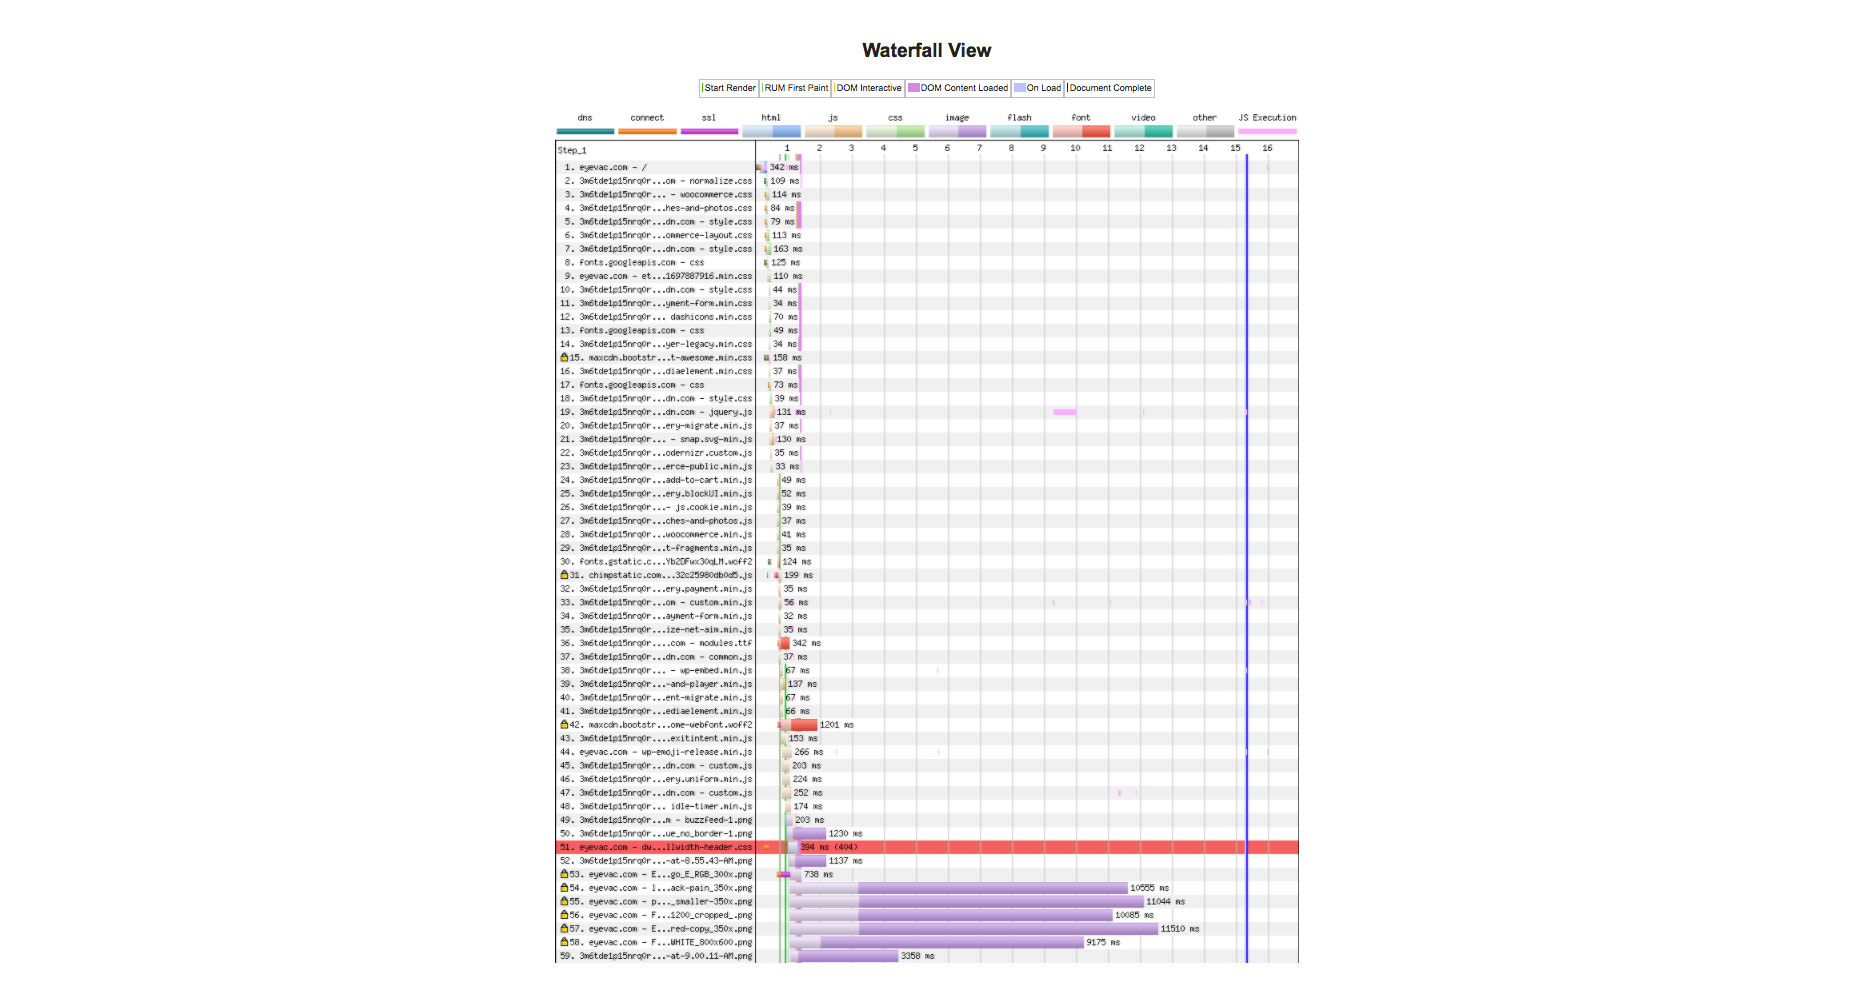
While the chart may seem overwhelming, it’s not too difficult to read. Every element is classified, and every class is color coded. On the left is the name of the file or resource (hovering over it while provide the full file name and location), and on the right the time is tracked in seconds, from when it starts loading to when it’s visible to when it’s done.
Even though this site scored an overall “A,” we can see there are some images that could tighten up the load speed significantly if they got some attention. If we want to go ever further, we can see that some fonts are taking a while to load, and something is spitting back a 404 error as well. Looking at the entire chart, we can start to pinpoint the exact files that are slowing our site down, and address them accordingly.
Addressing Issues Accordingly
Every website is different, and will require different fixes and maybe even different paths to those fixes than the next site. However, there are a few general tips for keeping your site lean and quick.
Optimize Media
Optimizing media simply means reducing the file size of images or video without sacrificing quality. This means they don’t take as long to transfer to a user’s browser, which means they don’t take as long to load. The actual process is pretty technical, but you can find tons of free tools online (Google PageSpeed Insights will even offer to do it for you when you run a test).
You can even preserve quality across devices by using the srcset attribute in your image tags. This lets you provide the tag with multiple images of varying resolutions and sizes, and the browser will choose the best one to serve to each user.
Minify Files
Like media optimization, minifying files is all about reducing file size. Most sites pull from a wide array of HTML, CSS, JavaScript, and other files. All it takes to minify them is to cut out unnecessary characters: spaces, line breaks, comments, etc. It’s generally best practice to keep two files: a “pretty” one for development purposes and a minified, “ugly” one for production. You could do this manually, but it’s much easier to run your files through a free tool instead.
Defer Loading of Files
If even a minified Javascript file is slowing your site down, you might consider deferring its loading until the rest of the page is loaded. For external files, you can accomplish this with a simple attribute on your script tags. Though if a plugin grabs these files automatically, and you don’t even see the script tags, things can get more complicated. For internal files, you can separate your code into “necessary for loading” and “unnecessary for loading,” put the unnecessary code into a separate file, then put this script near the bottom of your closing body tags.
Object Caching
Object caching is when files like HTML and images are temporarily stored on a user’s browser after they load. This is great since it means the page doesn’t even to reload fresh every time somebody hits the back button, or even when they come back a week later. There are tons of plugins on the market to help cache automatically, but it’s possible to do it yourself using APIs (like in WordPress or Drupal) if you so desire.
GZIP Compression
GZIP compression is fairly standard practice, but isn’t totally universal yet. The details of this practice could take up a blog post by themselves.
These are fundamental techniques for keeping your site loading fast, but there are more complex means available. It all depends on what exactly your site needs to reach those snappy load times. Hopefully learning about reading waterfall charts has pointed you in the right direction!
Nick Bergh


Read Next

15 Best New Fonts, July 2024

20 Best New Websites, July 2024

Top 7 WordPress Plugins for 2024: Enhance Your Site's Performance

Exciting New Tools for Designers, July 2024

3 Essential Design Trends, July 2024

15 Best New Fonts, June 2024

20 Best New Websites, June 2024

Exciting New Tools for Designers, June 2024

3 Essential Design Trends, June 2024

15 Best New Fonts, May 2024

How to Reduce The Carbon Footprint of Your Website
